Oct 5, 2026
Car Dealership Data Platform on Google Cloud
Automated Kaggle-to-BigQuery pipeline that turns dealership sales into financial KPIs (gross profit, EBITDA, target attainment) for Power BI, deployed on Google Cloud with infrastructure as code and continuous deployment.
Problem
In many dealership networks, performance reports (sales, gross profit, EBITDA, and target attainment per branch) are assembled by hand in Excel. Each close takes weeks, and the numbers arrive too late to support decisions. This project builds the alternative: an automated, reproducible, and verifiable flow from source to dashboard, refreshed daily.
Architecture
Kaggle API ─► raw/ (daily Parquet) ─► curated/ (Parquet) ─► BigQuery ─► Power BI
              └─────── Cloud Storage ───────┘
Cloud Scheduler (daily) ─► Cloud Run Job ─► runs the pipeline
| Layer | Where | Content |
|---|---|---|
| Source | Kaggle API | sales from a public dataset, personal data removed at load time |
raw |
Cloud Storage | validated sales, one Parquet file per day |
curated |
Cloud Storage | sales with cost and gross profit, plus monthly expenses and targets |
| Warehouse | BigQuery dealer_curated |
typed tables; ventas partitioned by date |
| Consumption | BigQuery dealer_marts |
dimensions and KPI views for Power BI |
Methodology
- Ingestion: download from the Kaggle API, cleaning, and one Parquet partition per day, with date-range backfill. Personal data (name, phone, gender, income) is dropped at load time and never reaches the lake.
- Curated: costs, expenses, and monthly targets simulated with pure functions, plus gross profit per sale.
- Quality: cross-layer validations that stop the pipeline before a bad batch propagates: columns, nulls, types, duplicates, price ranges, a 5%–25% margin, equal row counts between raw and curated, and no personal data.
- Warehouse (ELT): external tables over Parquet, typed native tables, and consumption views (
dim_concesionaria,dim_fecha,kpi_diario,kpi_mensual). KPIs are computed in SQL, not in Python or in the report:- EBITDA = gross profit − (payroll + rent + marketing + other expenses)
- Net income = EBITDA − depreciation − interest − taxes
- Power BI: DAX measures that sum amounts and then divide with
DIVIDE, instead of averaging ratios. - Operations: Terraform provisions the bucket, datasets, least-privilege service accounts, Secret Manager, Artifact Registry, the Cloud Run Job, and Cloud Scheduler. GitHub Actions tests, validates Terraform, and deploys an image tagged with the SHA of each commit to
main.
Design decisions
- Idempotent end to end: each run overwrites its partition and every BigQuery statement is
CREATE OR REPLACE. Running the same day twice never duplicates rows. - Reproducible simulation: every synthetic value is derived from a hash of its business key, not from a stateful generator. Batch order and size do not change the result.
- Same code locally and in the cloud: storage sits behind a common interface (
LocalStorage/GCSStorage), so local tests cover the logic that runs on GCP. - No credentials in the repository: the Kaggle token lives in Secret Manager, and GitHub authenticates to GCP through Workload Identity Federation, restricted to this repository and the
mainbranch.
Results
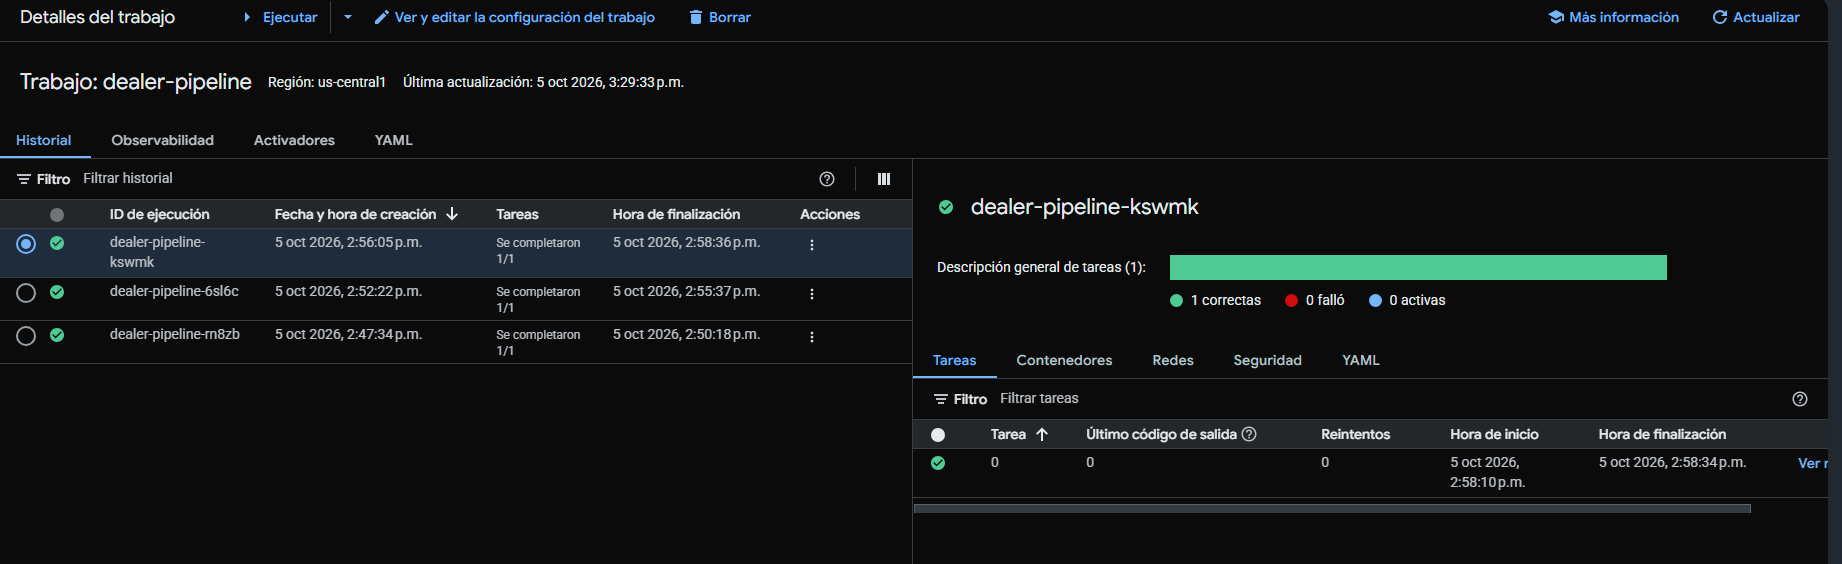
- 2022 historical load on Cloud Run: 10,645 sales from 28 dealerships across 292 days with sales. Each step takes 2 to 3 minutes: backfill 2:12, curate 2:51, and warehouse 2:10.
- Quality: validations passed with no issues; raw and curated hold the same 10,645 rows.
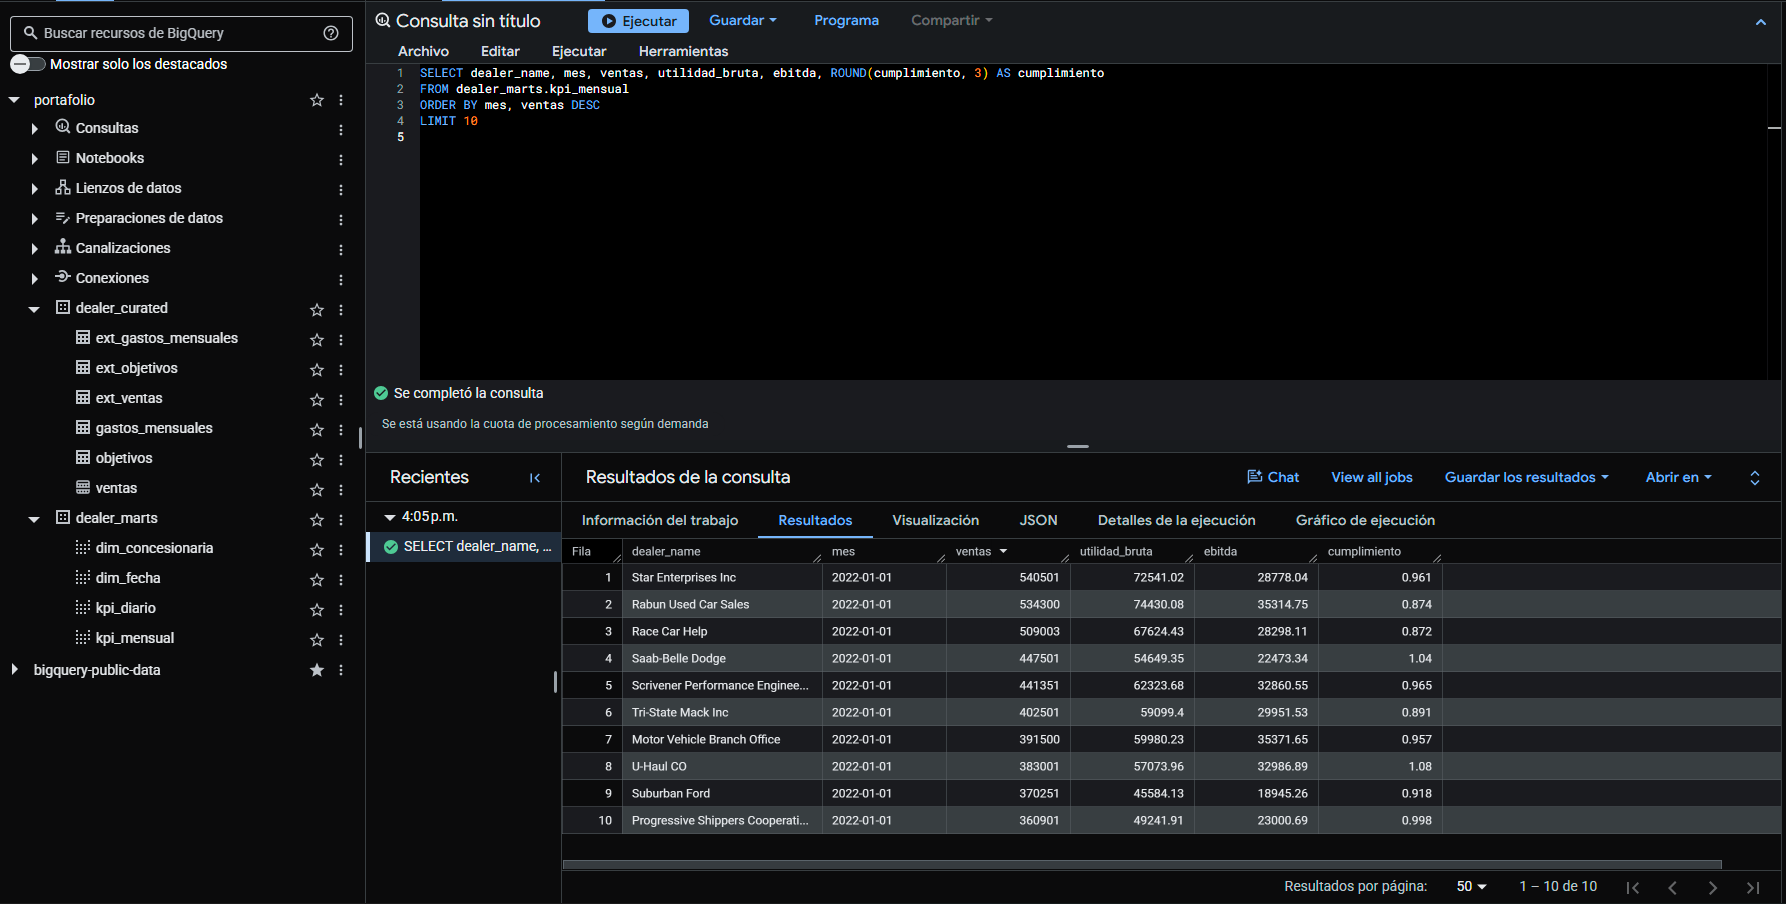
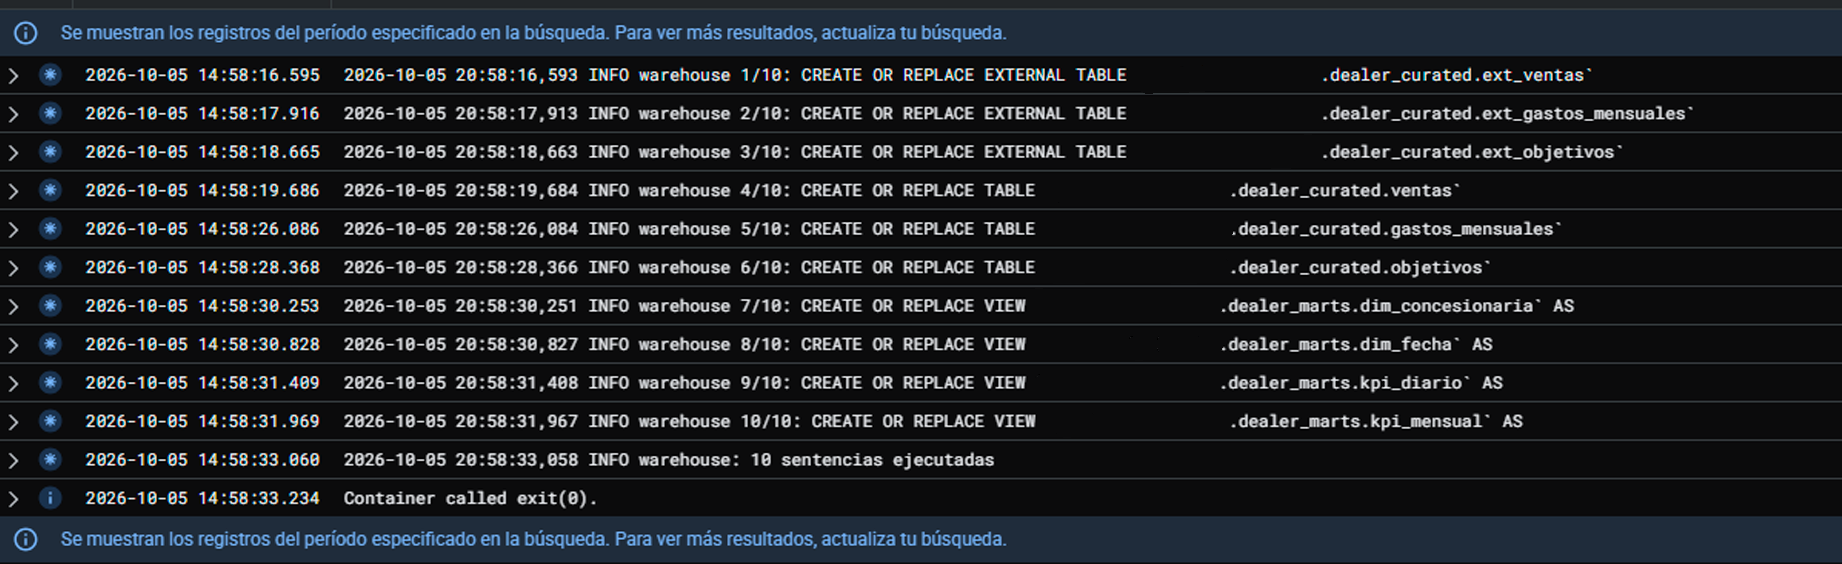
- Warehouse: 6 tables in
dealer_curatedand 4 views indealer_marts, rebuilt by 10 SQL statements. Annual gross margin of 13.95% and target attainment of 97.76% (synthetic figures). - CI/CD: 68 unit tests with no network or credentials; every push to
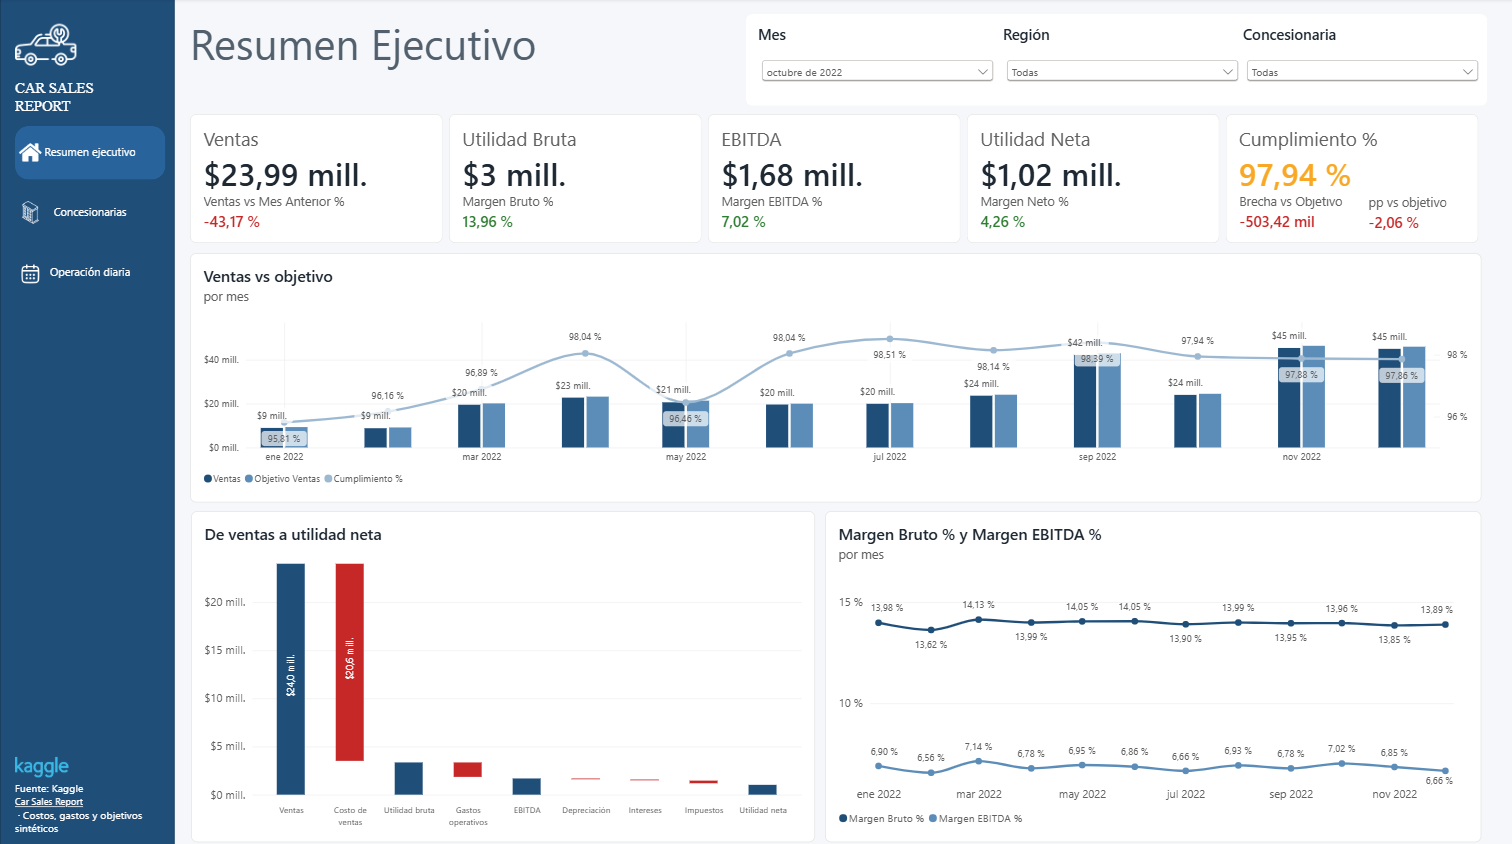
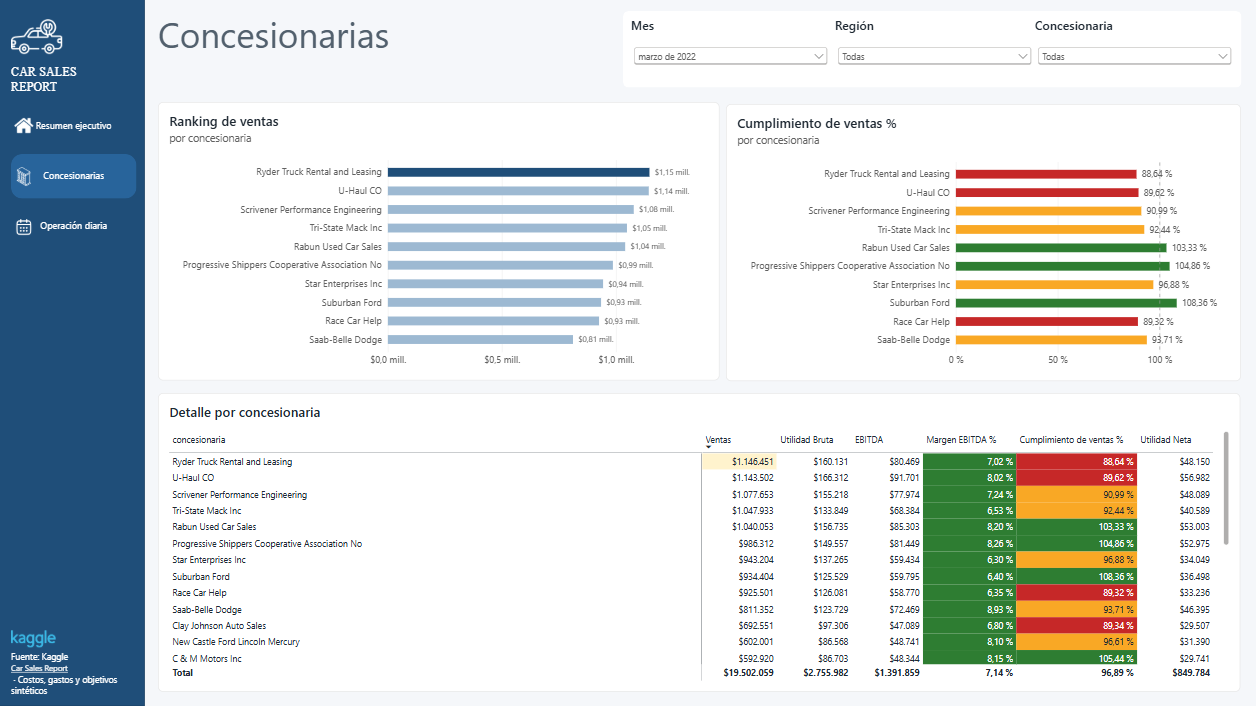
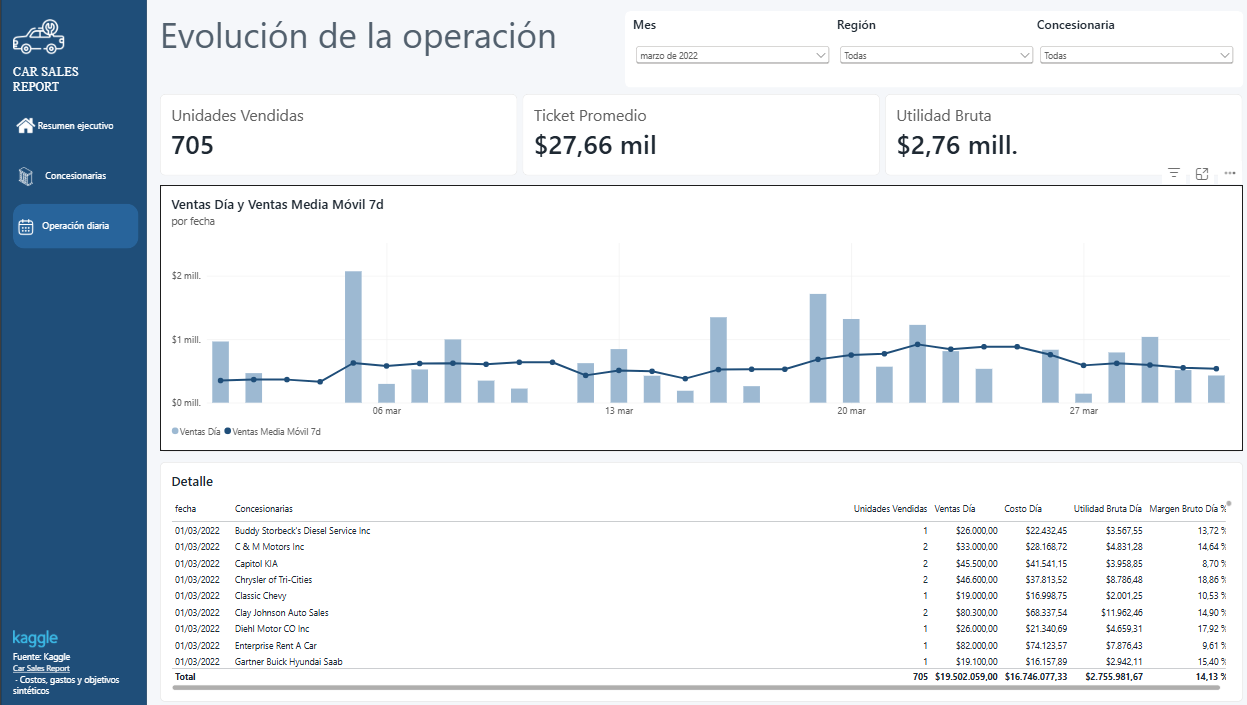
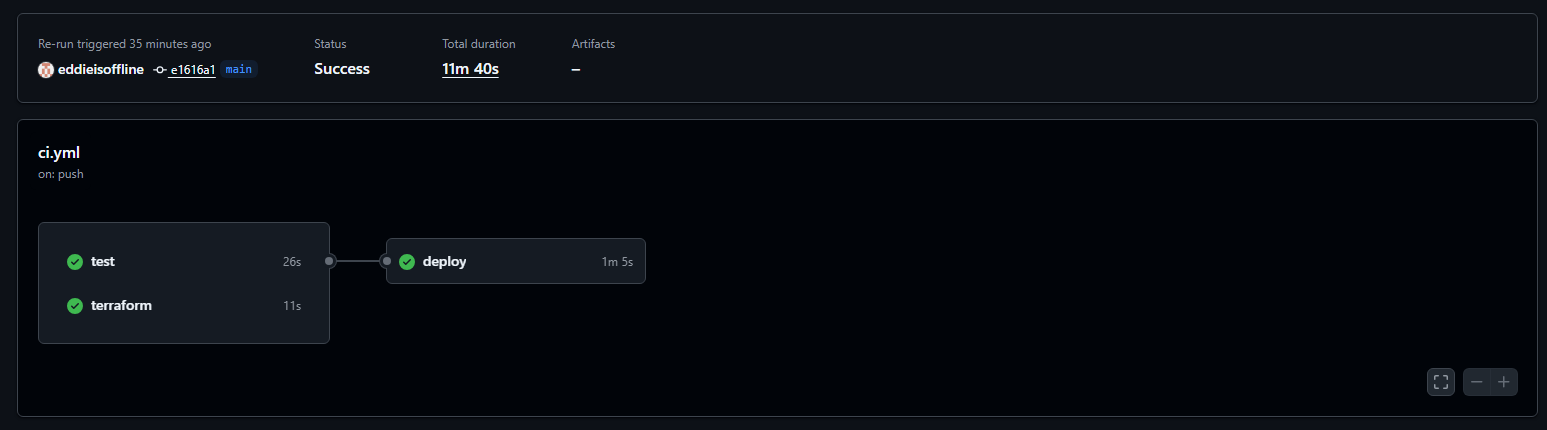
mainruns the tests, validates Terraform, and deploys the new image to the Cloud Run Job in about a minute. - Report: Power BI with an executive summary, a dealership comparison, and daily operations, connected to
dealer_marts.
Evidence on Google Cloud
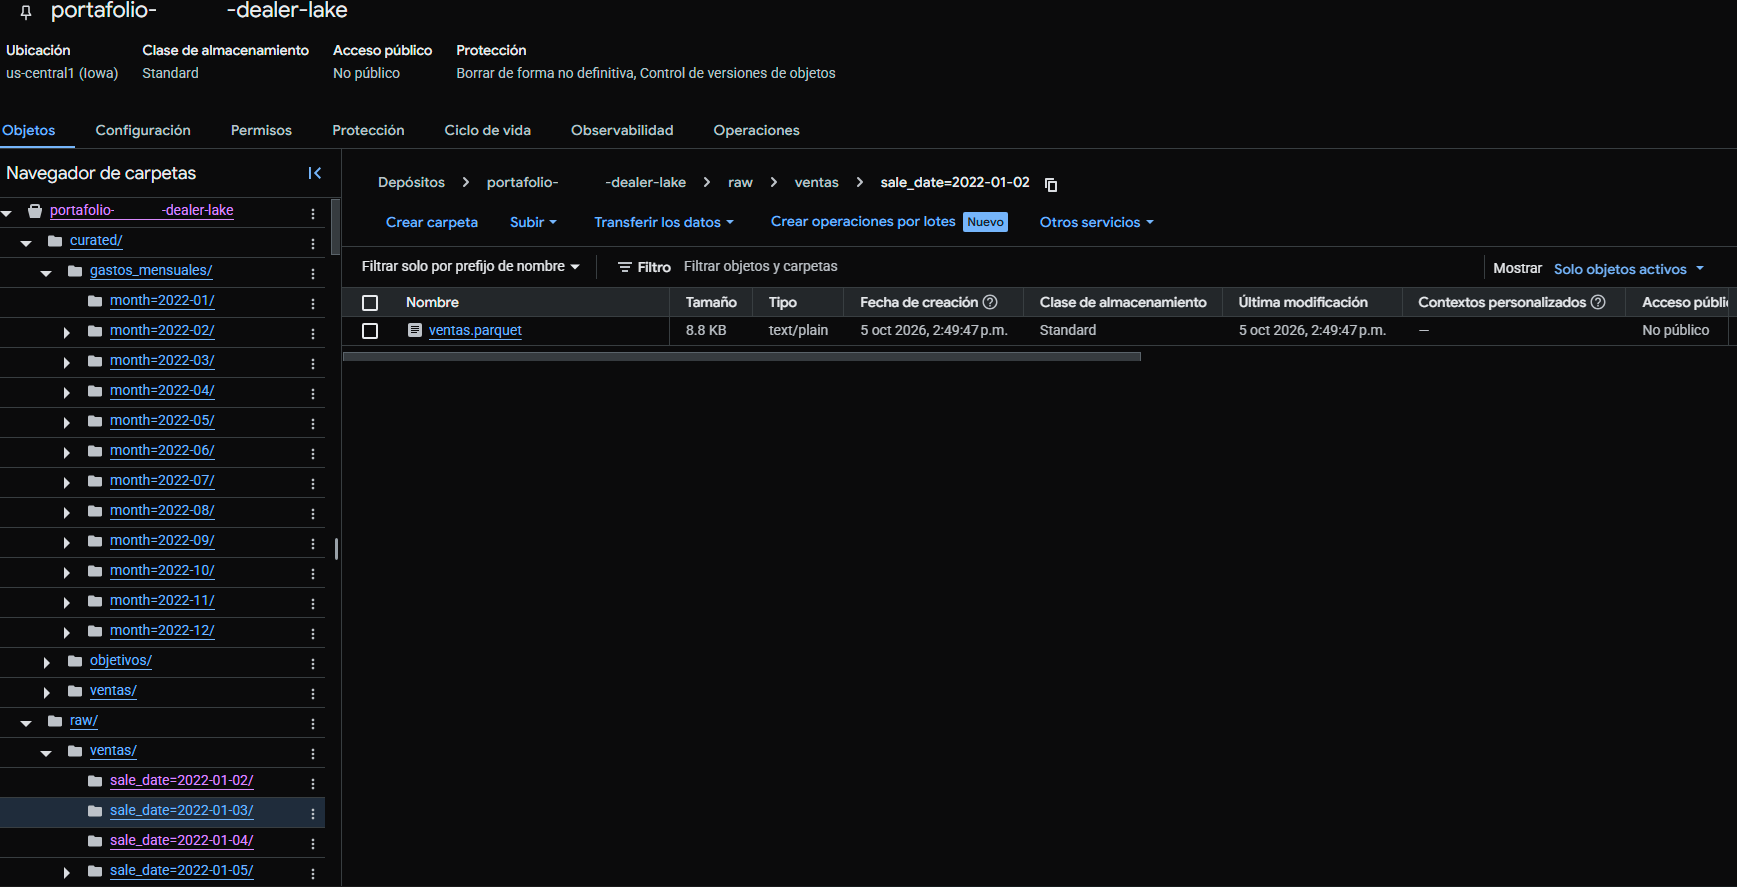
Cloud Storage data lake with daily (sale_date=) and monthly (month=) partitions:
BigQuery tables and views, with a query on kpi_mensual:
Cloud Run Job executions and warehouse refresh logs:
CI/CD on GitHub Actions:
Stack
Python (pandas, pyarrow) · SQL (BigQuery) · Google Cloud (Cloud Storage, BigQuery, Cloud Run Jobs, Cloud Scheduler, Secret Manager, Artifact Registry) · Terraform · Docker · GitHub Actions · Power BI
Data
The source is the public Car Sales Report dataset on Kaggle, which is static. Incremental loads are simulated by replaying one calendar day per run. Costs, expenses, and targets are synthetic (fixed seed) and do not represent any real company’s data.
Technical documentation (in Spanish): architecture and decisions, warehouse and Power BI, and Google Cloud deployment.